Typical profiles
To simulate self-consumption you need to know when the client consumes, not just how much. Radiaris offers several ways to obtain the hourly consumption curve, in order of preference:
- Real data from the client (CSV or Excel from the meter or from Datadis): see Your own curve.
- Annual consumption from the bill + typical profile: the most common case (90 % of projects).
- 12 monthly values (from the bills), spread over the hours with a standard profile.
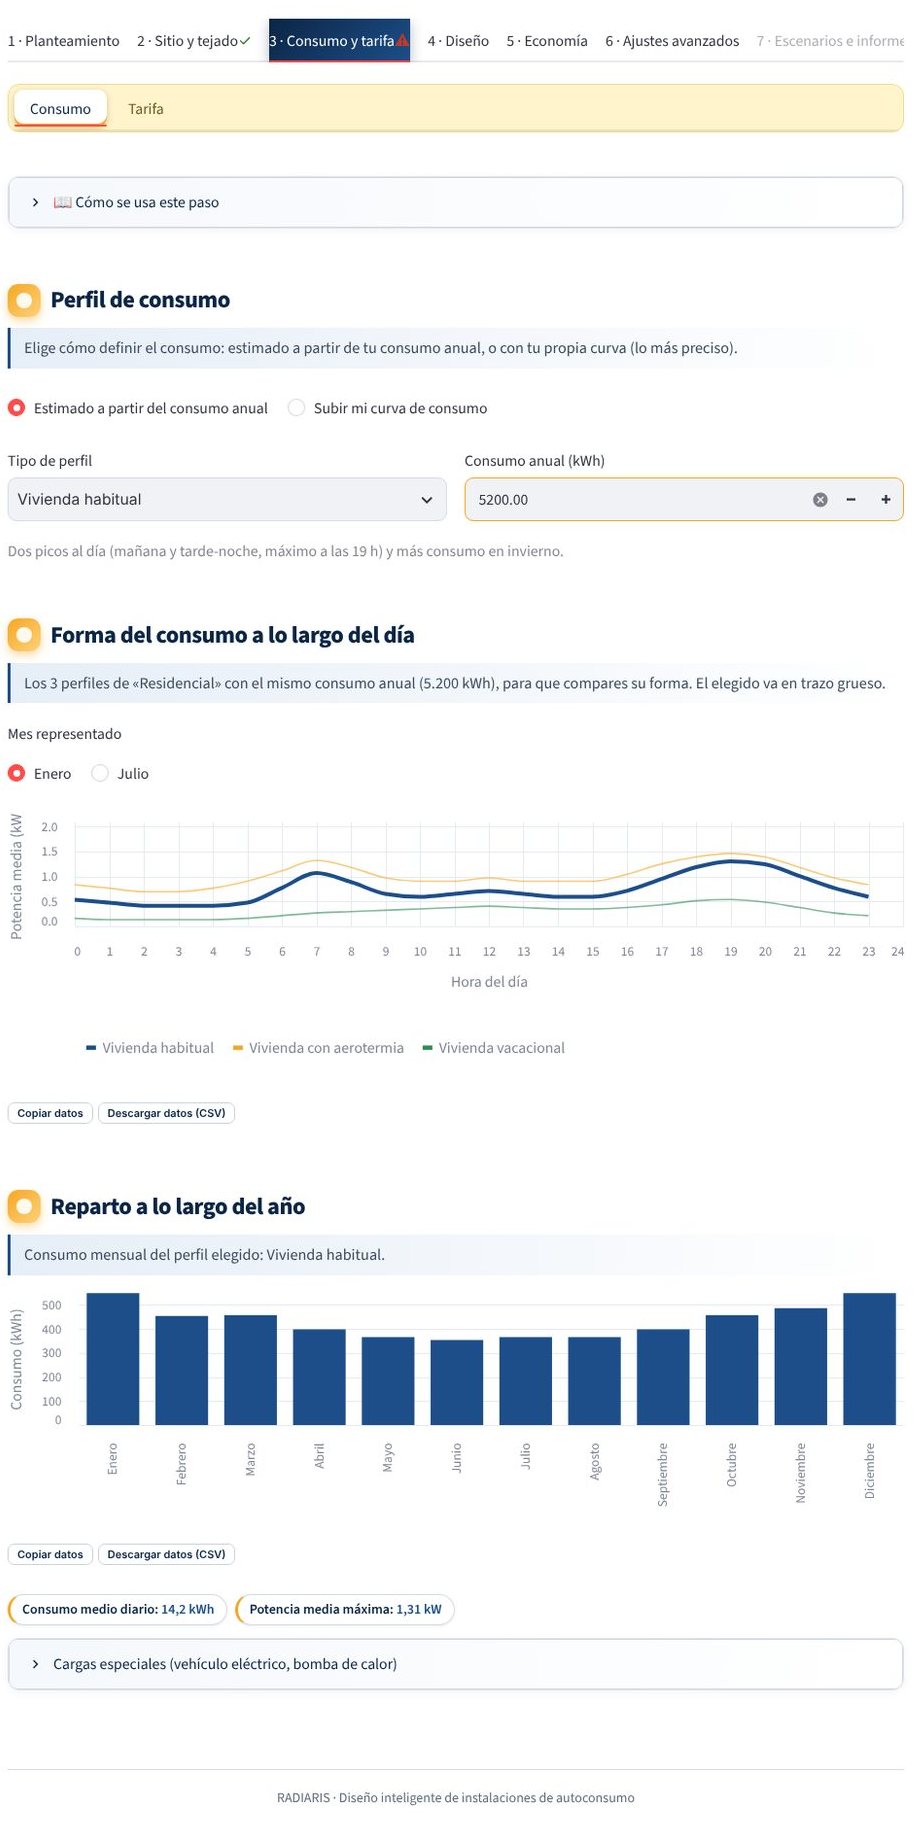
How the typical profile works
You enter the annual consumption (kWh) and choose a profile. The engine spreads it over hours and months:
- A 24-value hourly profile (the shape of the day).
- A 12-value monthly factor (seasonality).
Both are normalised so that the annual total is exactly the consumption you entered. The curves are statistical templates of usage patterns: they are not the client's data, they are a reasonable way to distribute their consumption.
Available profiles
| Client | Profile | Pattern |
|---|---|---|
| Residential | Primary residence | Morning and evening peaks; slightly higher in winter |
| Residential | Home with heat pump | Higher consumption in winter and at night |
| Residential | Holiday home | Concentrated in summer |
| Commercial | Office | Working hours, lower at weekends |
| Commercial | Shop | Opening hours, fairly flat over the year |
| Commercial | Restaurant | Peaks at midday and in the evening; higher in summer |
| Industrial | 1 shift | Daytime plateau |
| Industrial | 2 shifts | Extended plateau |
| Industrial | 3 shifts | Almost continuous 24 h consumption |
Reference values
If you have no bill, these indicative references (IDAE, Eurostat) help you estimate:
- Average Spanish household: about 3,500 kWh/year.
- Fixed base of a home: 800 kWh/year, plus about 500 kWh/year per person.
- Heat pump (heating and hot water): about +2,500 kWh/year.
- Industrial: highly variable; about 100 kWh/m²/year as an order of magnitude.
Monthly consumption
If you have the month-by-month consumption from the bills, upload a file with 12 monthly values (January–December) and choose the standard profile used to spread each month over the hours.
Charts
They show the shape of the day (January or July), the annual distribution and the total curve with the added loads.
The more real, the better
Self-consumption depends heavily on how well production and consumption coincide. With a typical profile the result is a good approximation; with the client's real curve it becomes truly accurate.