Summary and balance
When you press Simulate system, the results appear at the top of the application and are expanded in step 7 · Scenarios and report.
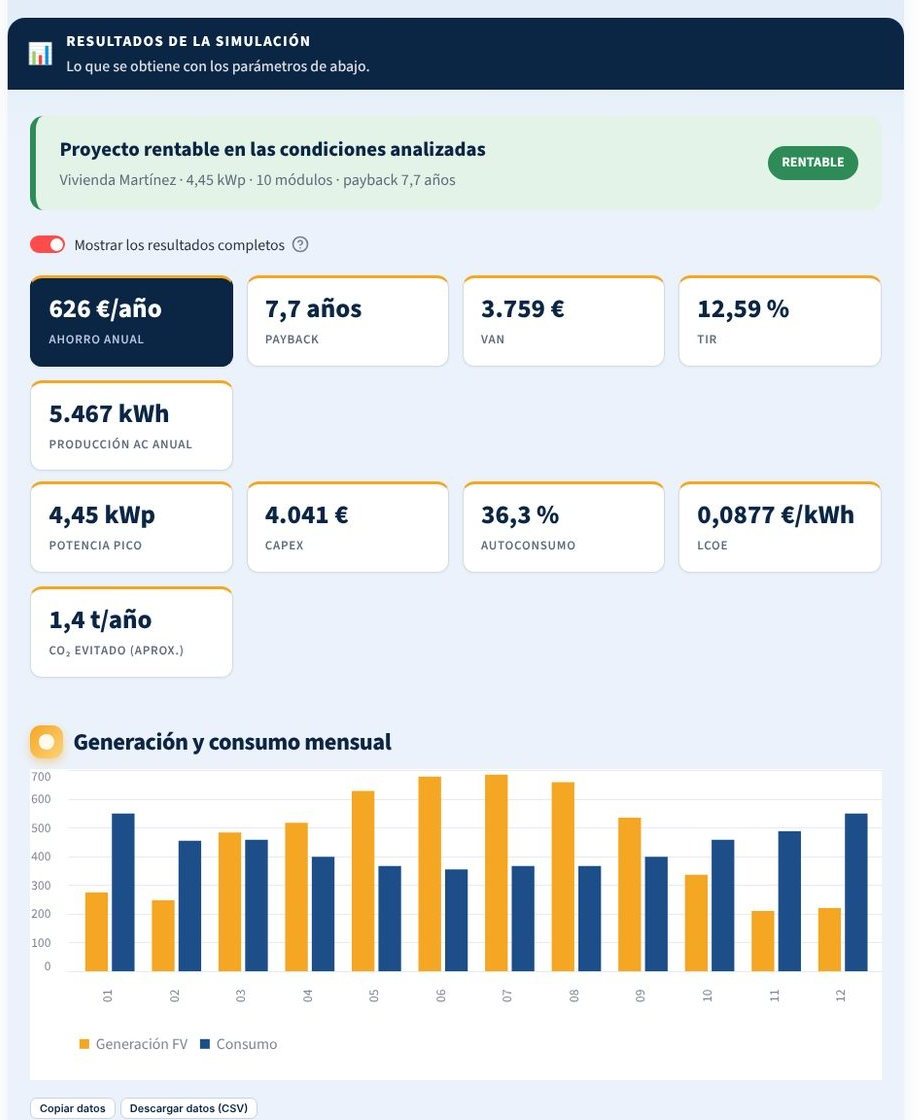
Verdict and key figures
A verdict («Profitable project under the conditions analysed») with the project name, client, power and payback, and below it the cards with the main figures:
| Figure | What it is |
|---|---|
| Annual savings | Self-consumption savings plus export income (year 1) |
| Payback | Years to recover the investment |
| NPV | Net present value at the chosen discount rate |
| IRR | Annual internal rate of return |
| Annual AC production | Net energy delivered by the inverter |
| Peak power | Installed kWp |
| CAPEX | Total investment including VAT |
| Self-consumption | % of the generation that is used |
| LCOE | Levelised cost of energy (€/kWh) |
| CO₂ avoided (approx.) | Indicative estimate of tonnes per year, with an average grid emission factor |
With «Show full results» enabled you see all of them; without it, the essential ones.
Monthly generation and consumption
Bar chart with the PV generation and the consumption of each month. It is the quickest way to see in which months there is surplus and in which there is a shortfall. Under each chart you have the buttons to copy, download CSV and save PNG.
Analysis details
It unfolds in this order: what the installation is like, what it loses along the way and where the energy goes.
Designed installation
- Sizing criterion, number of modules, peak power and batteries.
- Chosen module and inverter, with their source (catalogue, .PAN/.OND, imported…).
- Where and how it is connected table: for each MPPT input, the plane, strings, modules and power.
- Wiring diagram of the array, with inverter and loads.
- Row data if there are raised modules: spacing, rows used and tilt.
- Cabling and protections, if you have enabled it.
Loss waterfall
See Loss waterfall.
Energy balance
| Quantity | Definition |
|---|---|
| Generation | AC energy produced |
| Consumption | Energy consumed by the client |
| Self-consumption | Part of the generation consumed by the client, directly or via the battery |
| Export | Energy fed into the grid |
| Curtailment | Unused surplus (export limit, no export or off-grid) |
| Import | Energy bought from the grid |
| Battery charge / discharge | Energy going into and out of the battery |
| Uncovered deficit | Off-grid only: consumption not supplied |
And two ratios:
- Self-consumption ratio = (generation − export − curtailment) / generation: what part of what you produce the client uses.
- Self-sufficiency ratio = 1 − (import + deficit) / total load: what part of the client's consumption the installation covers.
With a battery, its charge, discharge and state of charge are also shown.
Cash flows
Year-by-year table and chart with savings, OPEX, replacements, loan payment and cumulative flow. See Indicators.
Warnings
Validation warnings (for example, a string out of range or a high DC/AC ratio) appear next to the result. Read them before accepting the result.
Next steps
Compare alternatives with the scenario comparator and deliver the PDF report and the offer.